 Photo by FT
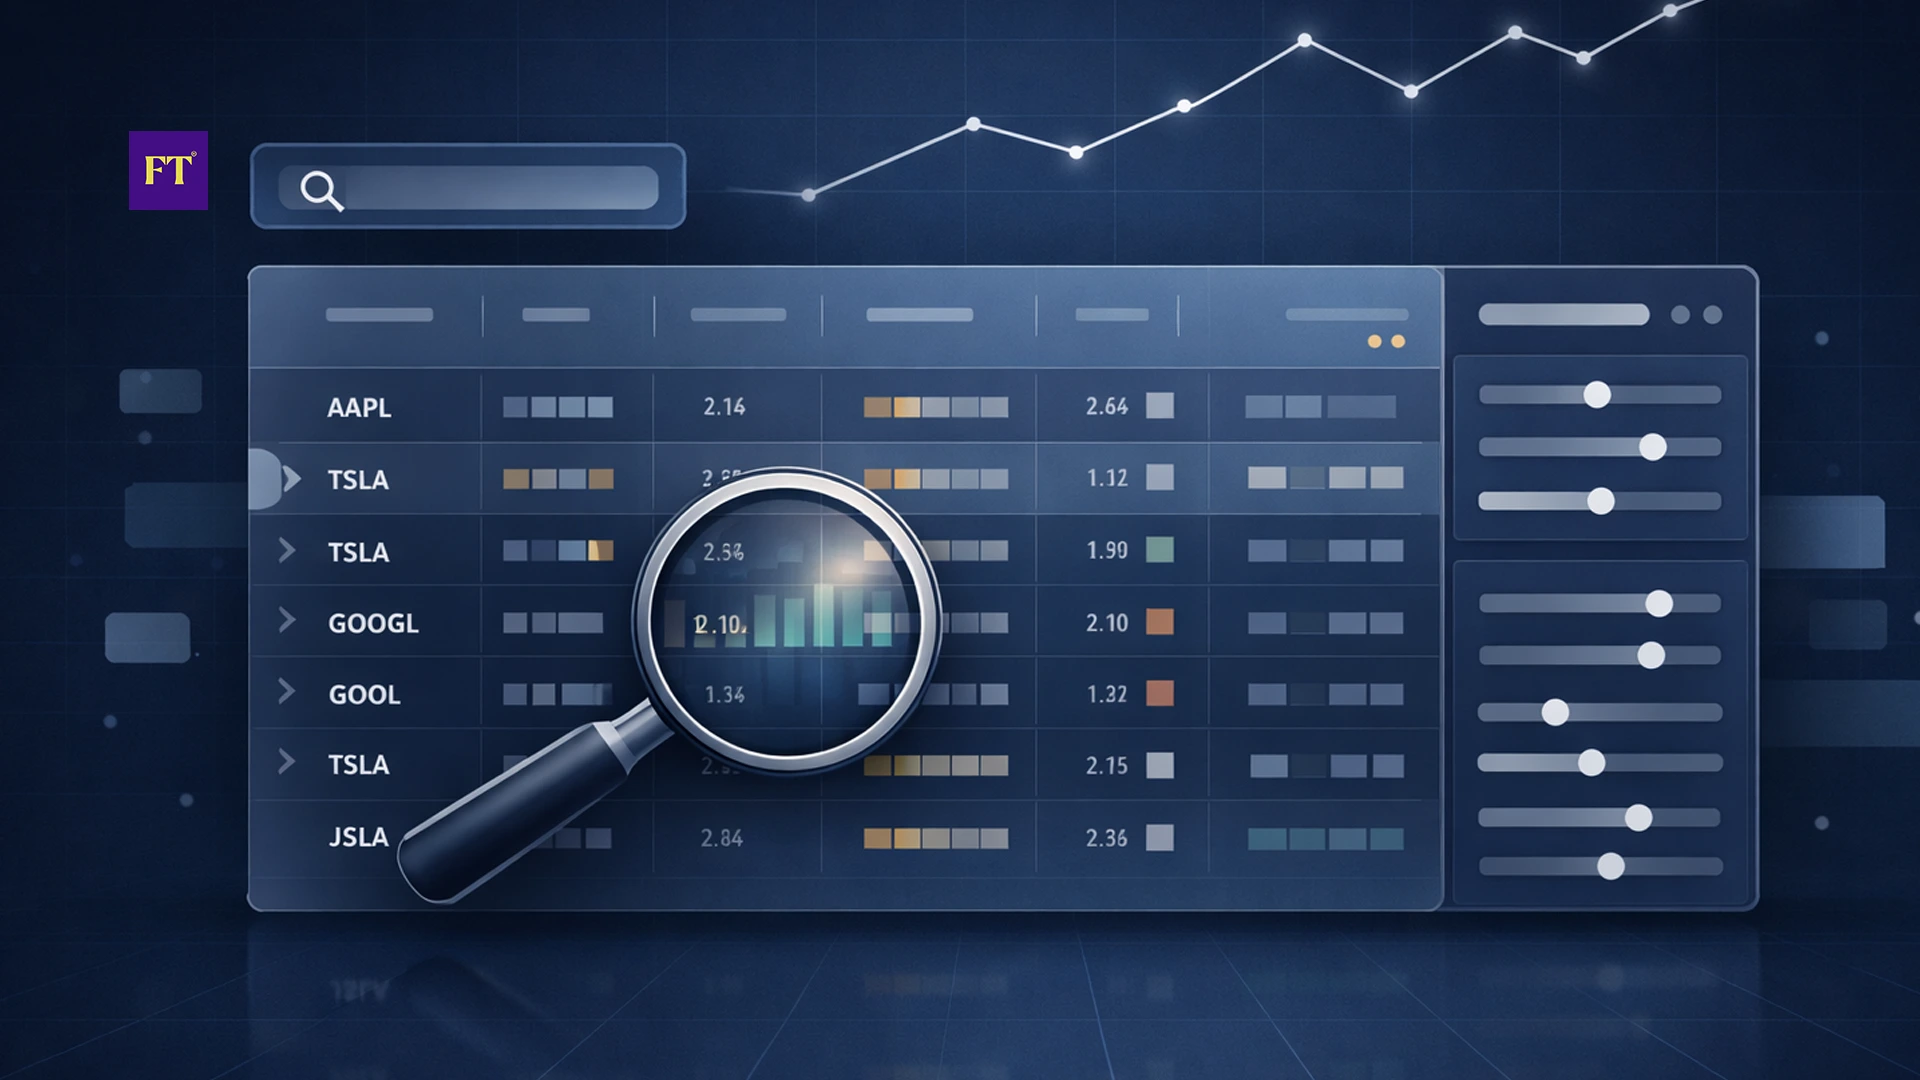
Stock Screener
- A stock screener tool filters listed securities using predefined financial and trading rules, scanning large datasets to return a narrowed set that matches user-defined numeric criteria such as valuation, earnings, revenue, dividends, price behaviour, and trading activity.
- These tools are used by investors, analysts, and institutions to process large volumes of financial information, supporting selection work based on measurable data rather than manual review of individual securities.
- Screening tools rely on structured inputs across valuation, earnings, trading, dividend, and balance sheet data, with outputs varying based on rule design, investor style, and the level of filtering applied.
NEW YORK, July 2, 2026 — A stock screener tool is a digital system used to filter listed securities using predefined financial and trading rules. Users set numeric parameters across valuation, earnings history, revenue movement, dividend records, price behaviour, and trading activity. The system scans large datasets of listed equities and returns a narrowed set that matches those rules. The function of this system is to reduce manual review across large volumes of securities, allowing users to define conditions that act as filters across structured data fields and generate a reduced set of securities that meet selected parameters.
Stock screening tools are used by individual investors, research analysts, and institutions that process large sets of financial information. These tools support selection work based on measurable data rather than manual review of every listed entity, offering structured filtering across valuation, earnings, trading, and income-related metrics depending on user-defined rule sets.
Data Fields Used for Stock Selection
Screening systems rely on structured financial and trading data sourced from company filings and exchange feeds, where each data field supports a different type of filtering rule. Valuation data includes ratios comparing share price with earnings, revenue, or asset value, while earnings data tracks profit results across quarterly and annual reporting cycles to identify consistency or variation in performance. Revenue data reflects sales movement across reporting periods, and balance sheet data includes debt levels, asset holdings, and capital structure information that supports evaluation through numerical indicators.
Trading data includes price movement history, volume changes, and volatility readings that allow filtering based on market behaviour over selected time frames. Dividend data tracks payout frequency, payout ratio, and historical distribution records, often used for income-focused selection work. Each field supports rule creation that removes securities not meeting selected thresholds, and multiple rules can be applied together to produce a reduced selection group for further review.
Use Across Investor Styles
Stock screener tools support different styles of equity selection through flexible rule setting, where long-horizon investors focus on earnings consistency, revenue patterns, and balance sheet strength, applying filters that remove companies with irregular financial records while retaining those with stable reporting patterns. Short-horizon participants focus on price movement, trading volume, and volatility readings, using filters that identify securities with active price behaviour suited for shorter holding periods.
Income-oriented participants focus on dividend history and payout patterns, selecting securities with repeated distribution records and stable payout ratios, while research-oriented users apply layered rule sets that include valuation, earnings, and trading indicators to produce structured lists for further examination through financial reports and comparative review. Across all styles, screening output functions as a starting set for deeper review rather than final selection.
Role Within Research Workflows and Limits
Stock screening tools are often used at the beginning of research workflows, where users define filter rules, run the screening process, and receive a reduced set of securities for further review. After screening, output is generated, and each selected security is examined through financial statements, earnings records, and comparative analysis with similar companies, forming a layered process that reduces the need to manually scan entire listing universes.
Many users save filter sets for repeated use, allowing consistent screening over time and ongoing monitoring of selected securities as financial data updates across reporting cycles. Screening output is also used for tracking securities that meet defined thresholds, though limitations exist due to reliance on reported financial data that may reflect earlier periods rather than recent developments.
Another limitation relates to the absence of qualitative assessment, since factors such as management quality, regulatory developments, and competitive positioning are not represented through numerical filters. Excess restriction in filter rules can reduce selection too heavily, while broad settings can generate large lists requiring further sorting, meaning rule design directly shapes output usefulness, and screening results function only as an initial sorting layer before allocation decisions.
Stock screener tools support different styles of equity selection through flexible rule setting, where long-horizon investors focus on earnings consistency, revenue patterns, and balance sheet strength, applying filters that remove companies with irregular financial records while retaining those with stable reporting patterns.
Related Topics

Financial Tools to Plan, Track, and Grow Your Money
An expense tracker records and categorizes daily spending across different categories such as food, transport, rent, utilities, subscriptions and discretionary expenses.
By

What is an SIP Calculator and Why It Matters
An SIP calculator helps convert regular saving behavior into a structured financial projection. Many investors find it difficult to understand how small monthly contributions can result in large accumulated values over long periods. The tool provides a numerical estimate that connects present contributions with future value.
By

What is an EMI Calculator
An EMI calculator uses a standard loan formula based on the principal amount, interest rate, and loan tenure. When these values are entered, the tool calculates a fixed monthly installment that remains constant throughout the repayment period.
By

What is a Retirement Calculator
Consider a person who saves a fixed amount every month and continues this pattern until retirement age. The calculator estimates how these contributions may grow over time based on an assumed rate of return.
By